
A public AI platform from Context Labs that makes EPA greenhouse gas data searchable, auditable, and citation-ready at national scale.
01 — WHAT IS OPENEPA?
Millions of data points. One coherent picture.

The EPA’s Greenhouse Gas Reporting Program (GHGRP) collects self-reported emissions data from thousands of industrial facilities across the U.S. That data has always been public, but navigating it at scale required significant technical expertise, time and manual effort.
OpenEPA solves that by doing three things:
1.
Find patterns across the full national dataset.
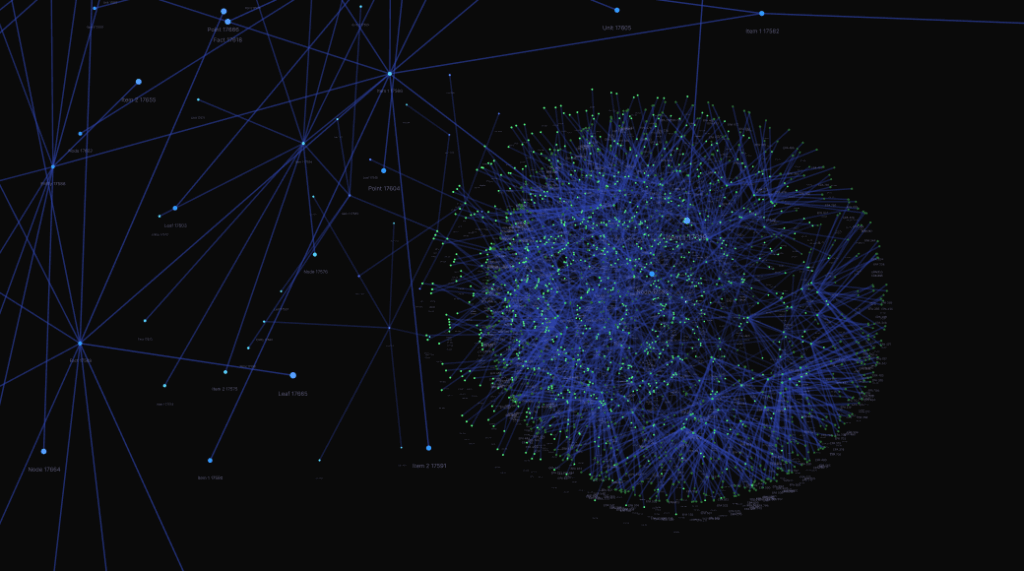
OpenEPA organizes historical EPA GHGRP data into an AI-enabled intelligence layer of more than 10 million entities and relationships. It connects facilities, operators, sectors and geographies so patterns across the national dataset become visible — including how emissions relate across the supply chain.
2.
Ask questions in plain language, get answers in seconds.
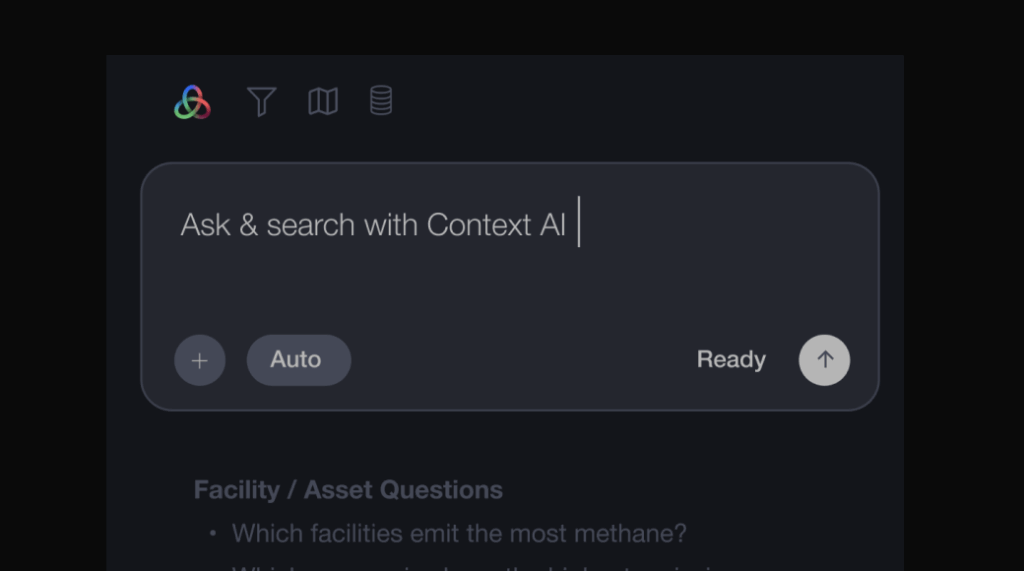
OpenEPA is built to improve access and usability for an existing public record, especially as public interfaces and tools change. Ask anything in plain language, the system navigates the intelligence layer and returns structured, sourced answers.
3.
Export findings with provenance that you can stand behind.
Every output carries a traceable provenance record — query context, filters applied, reporting categories used, and source references. That makes OpenEPA useful for not just exploration, but for policy work, journalism, and regulatory submissions where results need to hold up to scrutiny.
Used by researchers, journalists, and policymakers. Request early access →
02 — HOW DOES IT WORK?
The Technology behind OpenEPA.
OpenEPA Intelligence Layer
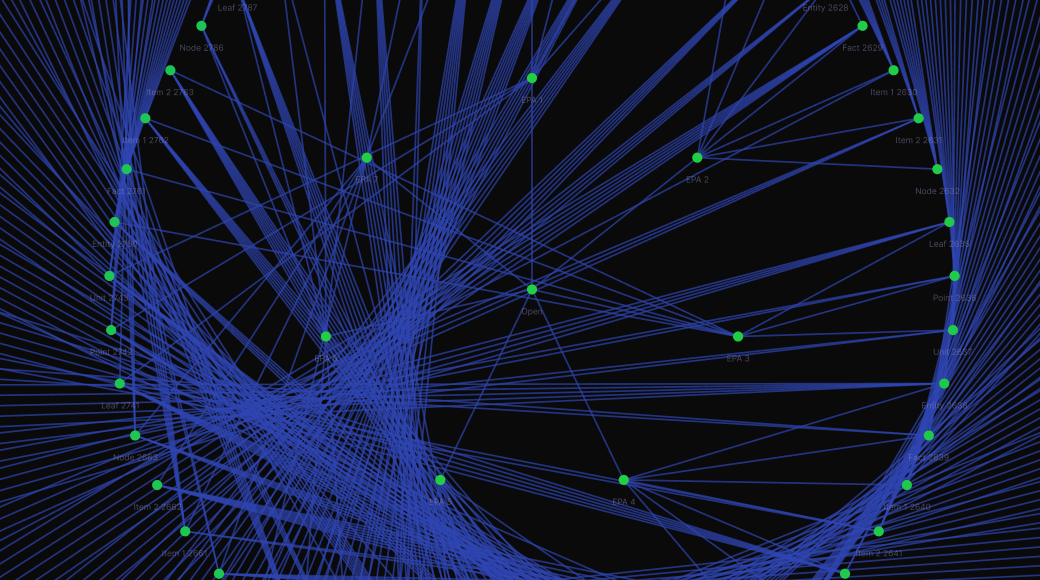
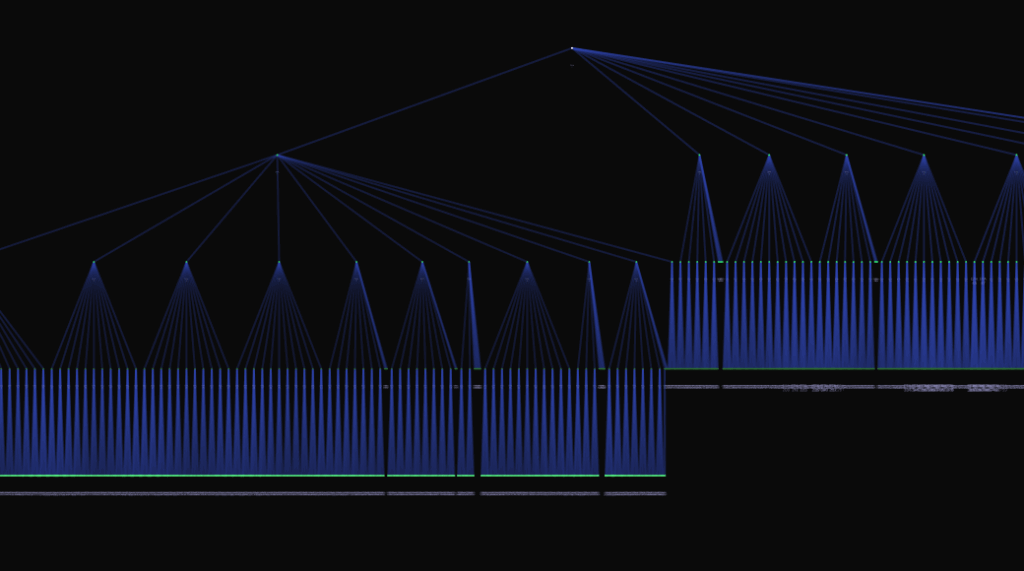
An intelligence layer transforms raw records into context-ready feedstock for AI by linking entities and their relationships—so you can run cross-cutting queries across the full national dataset. OpenEPA structures EPA GHGRP data as a graph of facilities, operators, sectors, geographies, and reporting categories, all connected.
OpenEPA Ontology
The ontology defines how concepts in GHGRP data relate to each other: subparts, source categories, facility types, reporting methodologies. It is what allows OpenEPA to understand that a question about a facility is also a question about its operator, its sector, and its reporting history.
Data Provenance
Every output from OpenEPA carries a provenance record: what was queried, what filters were applied, what reporting categories were used, and where the underlying data originated. In a world where AI outputs are often opaque, provenance is what makes OpenEPA’s results both useful and trustworthy, and what makes them publishable.
Get Early Access to OpenEPA
Opening in cohorts after CERAWeek.
03 — WHAT CAN YOU DO WITH IT?
Identify answers in seconds. Cite them with confidence.
The intelligence layer connects the data into clear relationships, so Context AI can interpret what is linked to what. It also carries provenance, so each result can be traced back to its source.
Auditability and Source Knowledge
Every result is traceable to the specific GHGRP subpart W submission, report, and facility record it came from. Filters, time bounds, and categories used are documented alongside every output, so findings can be independently reproduced and cited.
Human-Directive Through Context AI
Context AI operates on top of the Context Labs intelligence layer. Ask questions in plain language — Context AI navigates the graph, selects relevant entities, and assembles structured results with source references and exportable provenance.
The data was always there. Now it’s in Context.
04 — WHO IS IT FOR?
Questions from the people who use it.
- Spot the story: reporting anomaly detection
“Identify facilities with implausible year-over-year swings that revert the following year, flag potential reporting method changes.
- Cross-state operator comparison
“Which 3 operators had the largest absolute emissions increase between 2019 and 2020 across compressor sources in New Mexico and Texas combined?”
- Methane trends in New Mexico
“Tell the story of methane in New Mexico since 2016: which facility types grew, which declined, and which source categories drove the change?”
- Industrial corridor mapping
“Map contiguous areas where facility emissions exceed 2 standard deviations above the sector mean.”
- Inspector prioritization
“If I’m an inspector with limited time, which 10 Texas facilities should I prioritize — and why (trend + category dominance + absolute size)?”
GET EARLY ACCESS
Join the OpenEPA cohort.
We’re announcing OpenEPA at CERAWeek and opening access in cohorts. Join the list to receive updates and access timing.